Home » Earthquakes » California
California Earthquake Map Collection
Isoseismal Maps for Selected California Earthquakes
| Kern County Earthquake - 7.3 - July 21, 1952 |
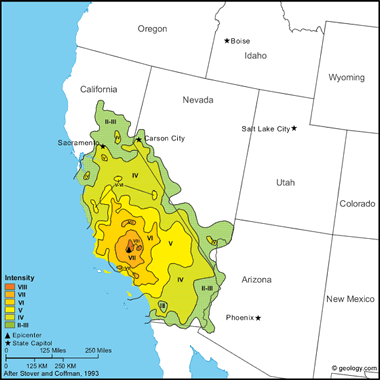
Kern County Earthquake, 1952: This earthquake was the largest in the conterminous United States since the San Francisco shock of 1906. It claimed 12 lives and caused property damage estimated at $60 million. MM intensity XI was assigned to a small area on the Southern Pacific Railroad southeast of Bealville. There, the earthquake cracked reinforced-concrete tunnels having walls 46 cm thick; it shortened the distance between portals of two tunnels about 2.5 meters and bent the rails into S-shaped curves. At Owens Lake (about 160 kilometers from the epicenter), salt beds shifted, and brine lines were bent into S-shapes.
Many surface ruptures were observed along the lower slopes of Bear Mountain, in the White Wolf fault zone. The somewhat flat, poorly consolidated alluvium in the valley was erratically cracked and recontoured. The cracking along Bear Mountain indicated that the mountain itself moved upward and to the north. Southwest of Arvin, on the San Joaquin Valley floor, ground cracks traversed and split the concrete foundation of one house, causing partial collapse. The ground slumped; cotton rows were offset more than 30 centimeters; and pavement on one highway was crumpled for more than 300 meters. East of Caliente, one large crack, about 1.5 meters at its widest point and more than 60 centimeters deep, was observed. Fill areas in the mountainous region along U.S. Highway 466 (now State Highway 58) settled from a few centimeters to more than 30 centimeters in places, and a large part of the highway was cracked and wrinkled. Northeast of that highway, the ground was displaced vertically about 60 centimeters and horizontally about 45 centimeters.
Maximum MM intensities in nearby cities did not exceed VIII. At Tehachapi, Bakersfield, and Arvin, old and poorly built masonry and adobe buildings were cracked, and some collapsed.
Property damage was heavy in Tehachapi, where both brick and adobe buildings were hit hard, and 9 people were killed. Three people were killed in other towns. Although damage was severe, the total extent of damage to property did not exceed that in Long Beach in 1933. Only a few woodframe structures were damaged seriously in this earthquake, compared to the 1933 shock in which many such structures were thrown off foundations.
The generally moderate damage in Bakersfield was confined mainly to isolated parapet failure. Cracks formed in many brick buildings, and older school buildings were damaged somewhat. In contrast, however, the Kern General Hospital was damaged heavily. Multistory steel and concrete structures sustained minor damage, which commonly was confined to the first story. Similar kinds of damage also occurred at Arvin, which lies southeast of Bakersfield and west of Tehachapi.
Reports of long-period wave effects from the earthquake were widespread. Water splashed from swimming pools as far distant as the Los Angeles area, where damage to tall buildings was nonstructural but extensive. Water also splashed in pressure tanks on tops of buildings in San Francisco. At least one building was damaged in San Diego, and in Las Vegas, Nevada, a building under construction required realignment of the structural steel.
The main shock was felt over most of California and in parts of western Arizona and western Nevada. It was observed at such distant points as Stirling City, California, Phoenix, Arizona, and Gerlach, Nevada. The California Institute of Technology at Pasadena recorded 188 aftershocks of magnitude 4.0 and higher through September 26, 1952; six aftershocks on July 21 were of magnitude 5.0 and higher. (from: United States Geological Survey Professional Paper 1527: Seismicity of the United States, 1568-1989, (revised), by C.W. Stover and J.L. Coffman, 1993, 418 pages) Larger map
Presented below is a collection of intensity maps and descriptions for several California earthquakes. The maps show the geographic distribution of ground shaking as gauged by the Modified Mercalli Intensity Scale. The maps were produced by obtaining intensity values from many locations within the felt area of the earthquake, plotting them on the map, and then contouring that data.
If you read the descriptions that accompany the maps, you will learn that the San Andreas Fault played an important role in most of California's large earthquakes.
The maps and descriptive accounts were first published as part of United States Geological Survey Professional Paper 1527: Seismicity of the United States, 1568-1989, (revised), by C.W. Stover and J.L. Coffman, 1993, 418 pages. The maps shown here were created by Brad Cole using Stover and Coffman's original work, but redrafting to a common scale and format that allows easy comparison.
| Quick Links To Earthquakes |
| Modified Mercalli Intensity Scale |
|
I. Not felt except by very few under especially favorable conditions.
II. Felt only by a few persons at rest, especially on upper floors of buildings. III. Felt quite noticeably by persons indoors, especially on upper floors of buildings. Many people do not recognize it as an earthquake. Standing motor cars may rock slightly. Vibrations similar to the passing of a truck. Duration estimated. IV. Felt indoors by many, outdoors by few during the day. At night, some awakened. Dishes, windows, doors disturbed; walls make cracking sound. Sensation like heavy truck striking building. Standing motor cars rocked noticeably. V. Felt by nearly everyone; many awakened. Some dishes, windows broken. Unstable objects overturned. Pendulum clocks may stop. VI. Felt by all, many frightened. Some heavy furniture moved; a few instances of fallen plaster. Damage slight. VII. Damage negligible in buildings of good design and construction; slight to moderate in well-built ordinary structures; considerable damage in poorly built or badly designed structures; some chimneys broken. VIII. Damage slight in specially designed structures; considerable damage in ordinary substantial buildings with partial collapse. Damage great in poorly built structures. Fall of chimneys, factory stacks, columns, monuments, walls. Heavy furniture overturned. IX. Damage considerable in specially designed structures; well-designed frame structures thrown out of plumb. Damage great in substantial buildings, with partial collapse. Buildings shifted off foundations. X. Some well-built wooden structures destroyed; most masonry and frame structures destroyed with foundations. Rails bent. XI. Few, if any (masonry) structures remain standing. Bridges destroyed. Rails bent greatly. XII. Damage total. Lines of sight and level are distorted. Objects thrown into the air. |
| Fort Tejon Earthquake - 7.9 - January 9, 1857 |
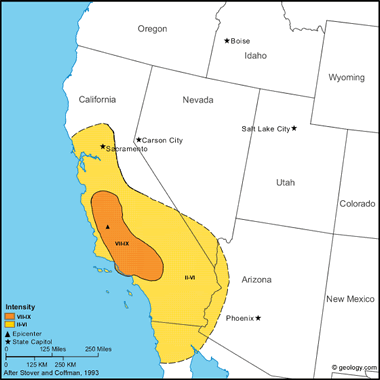
Fort Tejon Earthquake, 1857 This earthquake occurred on the San Andreas fault, which ruptured from near Parkfield (in the Cholame Valley) almost to Wrightwood (a distance of about 300 kilometers); horizontal displacement of as much as 9 meters was observed on the Carrizo Plain. It caused one fatality. A comparison of this shock to the San Francisco earthquake, which occurred on the San Andreas fault on Apr. 18, 1906, shows that the fault break in 1906 was longer but that the maximum and average displacements in 1857 were larger.
Property loss was heavy at Fort Tejon, an Army post about 7 kilometers from the San Andreas fault. Two buildings were declared unsafe, three others were damaged extensively but were habitable, and still others sustained moderate damage. About 20 kilometers west of Fort Tejon, trees were uprooted, and buildings were destroyed between Fort Tejon and Elizabeth Lake. One person was killed in the collapse of an adobe house at Gorman. Strong shaking lasted from 1 to 3 minutes.
Instances of seiching, fissuring, sandblows, and hydrologic changes were reported from Sacramento to the Colorado River delta. Ground fissures were observed in the beds of the Los Angeles, Santa Ana, and Santa Clara Rivers and at Santa Barbara. Sandblows occurred at Santa Barbara and in the flood plain of the Santa Clara River. One report describes sunken trees, possibly associated with liquefaction, in the area between Stockton and Sacramento. Changes in the flow of streams or springs were observed in the areas of San Diego, Santa Barbara, Isabella, and at the south end of San Joaquin Valley. The waters of the Kern, Lake, Los Angeles, and Mokulumne Rivers overflowed their banks. Changes in the flow of water in wells were reported from the Santa Clara Valley in northern California. Felt from Marysville south to San Diego and east to Las Vegas, Nev. Several slight to moderate foreshocks preceded the main shock by 1 to 9 hours. Many aftershocks occurred, and two (January 9 and 16) were large enough to have been widely felt. NOTE: Even though this was a very strong earthquake the intensity map is simple. This is because there were very few people in this area who wrote their observations. As a result the intensity map shows a general trend with much interpretation applied. (from: United States Geological Survey Professional Paper 1527: Seismicity of the United States, 1568-1989, (revised), by C.W. Stover and J.L. Coffman, 1993, 418 pages) Larger map
| Owens Valley Earthquake - 7.4 - March 26, 1872 |
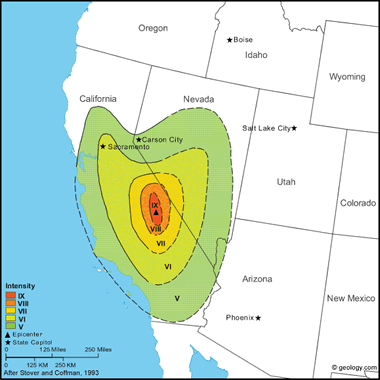
Owens Valley Earthquake, 1872: The most devastating effects of this earthquake occurred at Lone Pine, where 52 of 59 houses (mostly constructed of adobe or stone) were destroyed and 27 people were killed. A few fatalities also were reported in other parts of Owens Valley. One report states that the main buildings were thrown down in almost every town in Inyo County. About 100 kilometers south of Lone Pine, at Indian Wells, adobe houses sustained cracks. Property loss has been estimated at $250,000 in 1872 dollars.
Faulting occurred on the Owens Valley fault along a line a few kilometers east of the Sierra Nevada escarpment. The faulting near Lone Pine involved both dip-slip and right-lateral components of movement. The largest amount of surface deformation was observed between the towns of Lone Pine and Independence, but fault scarps formed along a length of at least 160 kilometers - from Haiwee Reservoir, south of Olancha, to Big Pine; cracks formed in the ground as far north as Bishop. The largest horizontal displacement of 7 meters was measured on the fault scarps west of Lone Pine. The vertical offsets clearly were smaller, averaging about 1 meter with the downthrown block on the east. A comparison of this earthquake to the earthquakes of 1857 and 1906 on the San Andreas fault shows the felt area and maximum fault displacements to be comparable. However, the shocks on the San Andreas fault ruptured the fault for significantly larger distances (300 kilometers in 1857 and 430 kilometers m in 1906).
This earthquake stopped clocks and awakened people at San Diego to the south, Red Bluff to the north, and Elko, Nevada, to the east. MM intensity VIII or larger was observed over an area of about 25,000 square kilometers, and MM intensity IX or larger was observed over an area of about 5,500 square kilometers. The shock was felt over most of California and much of Nevada. Thousands of aftershocks occurred, some severe. (from: United States Geological Survey Professional Paper 1527: Seismicity of the United States, 1568-1989, (revised), by C.W. Stover and J.L. Coffman, 1993, 418 pages) Larger map
| San Francisco Earthquake - 7.8 - April 18, 1906 |
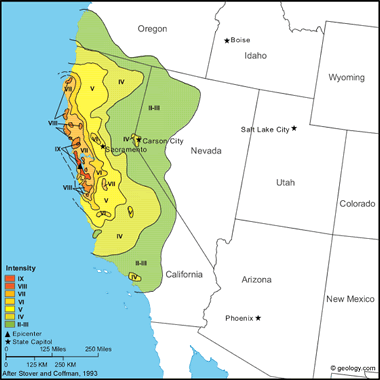
San Francisco Earthquake, 1906: This earthquake is one of the most devastating in the history of California. The earthquake and resulting fires caused an estimated 3,000 deaths and $524 million in property loss. Damage in San Francisco resulting only from the earthquake was estimated at $20 million; outside the city, it was estimated at $4 million. The sensible duration of the shaking in San Francisco was about 1 minute.
The earthquake damaged buildings and structures in all parts of the city and county of San Francisco, although over much of the area, the damage was moderate in amount and character. Most chimneys toppled or were badly broken. In the business district, which was built on ground made by filling in the cove of Yerba Buena, pavements were buckled, arched, and fissured; brick and frame houses of ordinary construction were damaged extensively or destroyed; sewers and water mains were broken; and streetcar tracks were bent into wavelike forms. On or near the San Andreas fault, buildings were destroyed (one was torn apart), and trees were knocked to the ground. The surface of the ground was torn and heaved into furrow-like ridges. Roads crossing the faultline were impassable, and pipelines were broken. One pipeline that carried water from San Andreas Lake to San Francisco was broken, shutting off the water supply to the city. The fires that ignited soon after the onset of the earthquake quickly raged through the city because of the lack of water to control them. They destroyed a large part of San Francisco and intensified the loss at Fort Bragg and Santa Rosa.
This earthquake caused the most lengthy rupture of a fault that has been observed in the contiguous United States. The displacement of the San Andreas Fault was observed over a distance of 300 kilometers from San Juan Bautista to Point Arena, where it passes out to sea. Additional displacement was observed farther north at Shelter Cove in Humbolt County, and, assuming the rupture was continuous, the total length of rupture would extend to 430 kilometers. The largest horizontal displacement - 6.4 meters - occurred near Point Reyes Station in Marin County.
In areas where dislocation of fences and roads indicated the amount of ground movement, motions of 3 to 4.5 meters were common. Near Point Arena, in Mendocino County, a fence and a row of trees were displaced almost 5 meters. At Wright's Station, in Santa Clara County, a lateral displacement of 1.4 meters was observed. Vertical displacement of as much as 0.9 meter was observed near Fort Ross in Sonoma County. Vertical displacement was not detected toward the south end of the fault.
Although Santa Rosa lies about 30 kilometers from the San Andreas fault, damage to property was severe, and 50 people were killed. The earthquake also was severe in the Los Banos area of the western San Joaquin Valley, where the MM intensity more than 48 km from the fault zone was IX. Santa Rosa lies directly inland from the region of greatest motion on the San Andreas fault.
Trees swayed violently, and some were broken off above the ground or thrown down. The water in springs and artesian wells either increased or decreased its flow. A few sand craterlets formed in areas where water was ejected through cracks or fissures.
The region of destructive intensity extended over a distance of 600 kilometers. The total felt area included most of California and parts of western Nevada and southern Oregon. The maximum intensity of XI was based on geologic effects, but the highest intensity based on damage was IX. Several foreshocks probably occurred, and many aftershocks were reported, some of which were severe. (from: United States Geological Survey Professional Paper 1527: Seismicity of the United States, 1568-1989, (revised), by C.W. Stover and J.L. Coffman, 1993, 418 pages) Larger map
| Borrego Mountain Earthquake - 6.5 - April 9, 1968 |
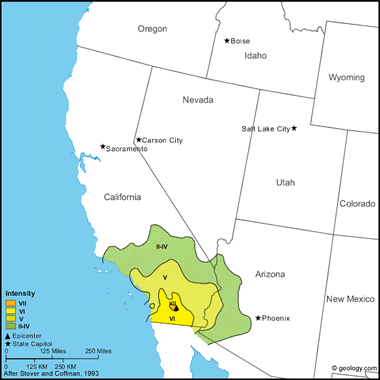
Borrego Mountain Earthquake, 1968: Along the Coyote Creek fault, surface rupture 31 kilometers in length was observed. Highway 78 sustained cracks adjacent to Ocotillo Wells. Rockslides occurred in Palm Canyon, Split Mountain, and Font's Head in the Anza-Borrego Desert State Park, and huge boulders blocked the Montezuma-Borrego Highway. The walls of one house at Ocotillo Wells were split over doorways and at corners of rooms, and the bedroom was separated from the rest of the house. The main shock was felt over a large area, including southern California, southwest Arizona, and southern Nevada. Several aftershocks were reported. The largest one knocked plaster to the floor in a theater at Calexico. (from: United States Geological Survey Professional Paper 1527: Seismicity of the United States, 1568-1989, (revised), by C.W. Stover and J.L. Coffman, 1993, 418 pages) Larger map
| San Fernando Earthquake - 6.6 - February 9, 1971 |
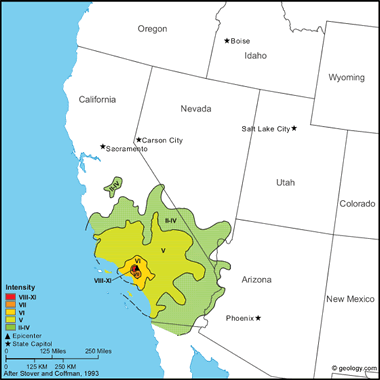
San Fernando Earthquake, 1971 This destructive earthquake occurred in a sparsely populated area of the San Gabriel Mountains, near San Fernando. It lasted about 60 seconds, and, in that brief span of time, took 65 lives, injured more than 2,000, and caused property damage estimated at $505 million.
The earthquake created a zone of discontinuous surface faulting, named the San Fernando fault zone, which partly follows the boundary between the San Gabriel Mountains and the San Fernando-Tujunga Valleys and partly transects the northern salient of the San Fernando Valley. This latter zone of tectonic ruptures was associated with some of the heaviest property damage sustained in the region. Within the entire length of the surface faulting, which extended roughly east-west for about 15 kilometers, the maximum vertical offset measured on a single scarp was about 1 meter, the maximum lateral offset about 1 meter, and the maximum shortening (thrust component) about 0.9 meter.
The most spectacular damage included the destruction of major structures at the Olive View and the Veterans Administration Hospitals and the collapse of freeway overpasses. The newly built, earthquake-resistant buildings at the Olive View Hospital in Sylmar were destroyed, four five-story wings pulled away from the main building and three stair towers toppled. Older, unreinforced masonry buildings collapsed at the Veterans Administration Hospital at San Fernando, killing 49 people. Many older buildings in the Alhambra, Beverly Hills, Burbank, and Glendale areas were damaged beyond repair, and thousands of chimneys were damaged in the region. Public utilities and facilities of all kinds were damaged, both above and below ground.
Severe ground fracturing and landslides were responsible for extensive damage in areas where faulting was not observed. The most damaging landslide occurred in the Upper Lake area of Van Norman Lakes, where highway overpasses, railroads, pipelines, and almost all structures in the path of the slide were damaged severely. Several overpasses collapsed. Two dams were damaged severely (Lower Van Norman Dam and Pacoima Dam), and three others sustained minor damage. Widespread landslides and rockfalls blocked many highways in the area.
Felt throughout southern California and into western Arizona and southern Nevada. No foreshocks were recorded, but aftershocks were reported in the area for several months. (from: United States Geological Survey Professional Paper 1527: Seismicity of the United States, 1568-1989, (revised), by C.W. Stover and J.L. Coffman, 1993, 418 pages) Larger map
| Long Beach Earthquake - 6.4 - March 11, 1933 |
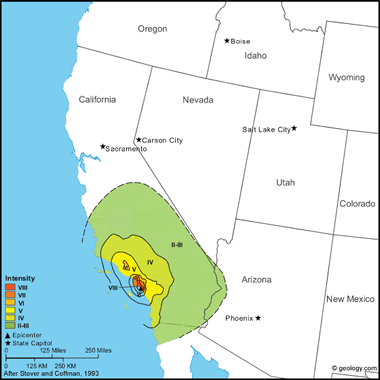
Long Beach Earthquake, 1933: Although only moderate in terms of magnitude, this earthquake caused serious damage to weak masonry structures on land fill from Los Angeles south to Laguna Beach. Property damage was estimated at $40 million, and 115 people were killed.
Severe property damage occurred at Compton, Long Beach, and other towns in the area. Most of the spectacular structural damage was due to land fill, or deep water-soaked alluvium or sand, and to badly designed buildings. Minor disturbances of groundwater, secondary cracks in the ground, and slight earth slumps occurred, but surface faulting was not observed. Along the shore between Long Beach and Newport Beach, the settling or lateral movement of road fills across marshy land caused much damage to the concrete highway surfaces and to approaches to highway bridges.
At Compton, almost every building in a three-block radius on unconsolidated material and land fill was destroyed. At Long Beach, buildings collapsed, houses were pushed from foundations, walls were knocked down, and tanks and chimneys fell through roofs. Damage to school buildings, which were among the structures most commonly and severely damaged by this earthquake, led to the State Legislature passing the Field Act, which now regulates building-construction practices in California. This destructive earthquake was associated with the Newport-Inglewood fault. Shocks similar in magnitude and intensity to this event have occurred in this area in the past - notably July 28, 1769; December 8, 1812; and July 11, 1855.
The earthquake was felt almost everywhere in the 10 southern counties of California and at some points farther to the northwest and north in the Coast Range, the San Joaquin Valley, the Sierra Nevada, and the Owens Valley. It also was reported in northern Baja California. A sharp foreshock occurred near Huntington Beach on March 9, and many aftershocks occurred through March 16. For several years, minor aftershocks continued to occur, most often centering near the two ends of the disturbed segment of the Newport-Inglewood fault. (from: United States Geological Survey Professional Paper 1527: Seismicity of the United States, 1568-1989, (revised), by C.W. Stover and J.L. Coffman, 1993, 418 pages) Larger map
| Coalinga Earthquake - 6.4 - May 2, 1983 |
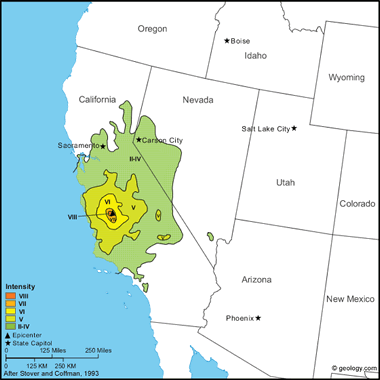
Coalinga Earthquake, 1983: This earthquake caused an estimated $10 million in property damage (according to the American Red Cross) and injured 94 people. Damage was most severe in Coalinga, where the 8-block downtown commercial district was almost completely destroyed. Here, buildings having unreinforced brick walls sustained the heaviest damage. Newer buildings, however, such as the Bank of America and the Guarantee Savings and Loan buildings, sustained only superficial damage. The most significant damage outside the Coalinga area occurred at Avenal, 31 km southeast of the epicenter.
A disaster assessment by the American Red Cross listed the following statistics on damage in the area: almost destroyed-309 single-family houses and 33 apartment buildings; major damage-558 single-family houses, 94 mobile homes, and 39 apartment buildings; and minor damage-8ll single-family houses, 22 mobile homes, and 70 apartment buildings. Most public buildings, including the City Hall, hospital, schools, fire house, post office, and police station, sustained only minor damage.
Only six bridges of 60 surveyed in the area sustained measurable structural damage. This damage consisted of hairline cracks and spalling at the top of the support columns, fracturing and displacement of wingwalls and parapets, and settlement of fill.
All public utilities were damaged to some degree. The water system continued to function despite many leaks in its transmission piping. Gas was shut off for several days because of broken piping and leaks, but only temporary interruptions of electric and telephone services were reported. One large section of old concrete sewer pipe west of the downtown area partly collapsed, but this system also continued to function.
In the oil fields near Coalinga, surface facilities such as pumping units, storage tanks, pipelines, and support buildings were all damaged to some degree. One oil company administration building, about 7 kilometers north of Coalinga, sustained major structural damage and its two brick chimneys were toppled. Subsurface damage, including collapsed or parted well casing, was observed only on 14 of 1,725 active wells.
This earthquake triggered thousands of rockfalls and rockslides as far as 34 kilometers northwest, 15 kilometers south, and 26 kilometers southwest of the epicenter. Only a few slope failures occurred east of the epicenter because of the absence of steep slopes in that direction.
This damaging earthquake was caused by an 0.5-meter uplift of Anticline Ridge northeast of Coalinga, but surface faulting was not observed. Ground and aerial searches immediately after the earthquake revealed ground cracks and fissures within about 10 km of the instrumental epicenter, none of which appeared to represent movement on deeply rooted fault structures. About 5 weeks later, on June 11, however, an aftershock caused surface faulting about 12 kilometers northwest of Coalinga.
Felt from the Los Angeles area north to Susanville (Lassen County) and from the coast east to western Nevada. Through July 31, more than 5,000 aftershocks were recorded, of which 894 had a magnitude of 2.5 or larger. Most of the larger magnitude shocks were felt in Coalinga. (from: United States Geological Survey Professional Paper 1527: Seismicity of the United States, 1568-1989, (revised), by C.W. Stover and J.L. Coffman, 1993, 418 pages) Larger map
| Kern County Earthquake - 6.3 - March 15, 1946 |
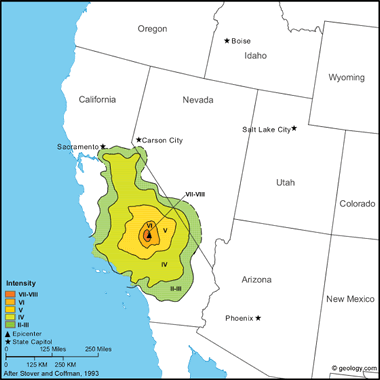
Kern County Earthquake, 1946: The main shock caused moderate damage at Onyx, about 19 kilometers southwest of the epicenter. Damage to wood, brick, masonry, and concrete was reported to be considerable. Chimneys, walls, plaster, and windows cracked; dishes broke; and plaster, books, and pictures fell. Cracks formed in the ground and concrete along the Los Angeles Aqueduct. Rockslides occurred in the canyons. Elsewhere in the region of Walker Pass and the South Fork of the Kern River, adobe houses were damaged, brick chimneys cracked, and plaster fell.
The earthquakes were felt from Commache (Calaveras County) on the north to San Diego (an isolated report) on the south and from Cambria (San Luis Obispo County) on the coast to Death Valley. Several aftershocks occurred. (from: United States Geological Survey Professional Paper 1527: Seismicity of the United States, 1568-1989, (revised), by C.W. Stover and J.L. Coffman, 1993, 418 pages) Larger map
| Riverside County Earthquake - 6.5 - December 4, 1948 |
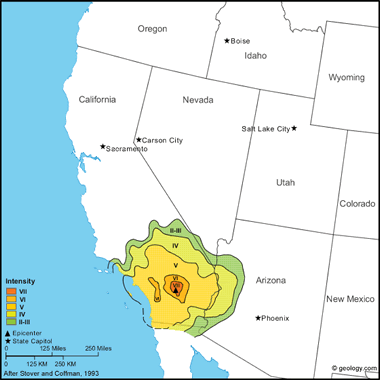
Riverside County Earthquake, 1948: The earthquake probably was caused by displacement on the Mission Creek fault, one of the major branches of the San Andreas fault system in southern California. The highest intensities in the area were reported from the upper Coachella Valley from Thousand Palms to White Water, which also was the most densely populated area near the epicenter.
Considerable structural damage and slight cracks in the ground were observed in Desert Hot Springs. Some minor structural damage also occurred at Palm Springs. At Willis Palms, cracks formed in the ground and cliffs, riverbanks slumped, and springs increased in flow. Landslides and cracks in the ground were reported in the Indio Hills. Felt throughout southern California and at a few towns in western Arizona, southwest Nevada, and northern Baja California. About 72 aftershocks were accurately located in a zone 18 kilometers long, parallel to (but 5 kilometers north of) the trace of the Mission Creek fault. (from: United States Geological Survey Professional Paper 1527: Seismicity of the United States, 1568-1989, (revised), by C.W. Stover and J.L. Coffman, 1993, 418 pages) Larger map
| Santa Cruz Mountains Earthquake - 6.9 - October 17, 1989 |
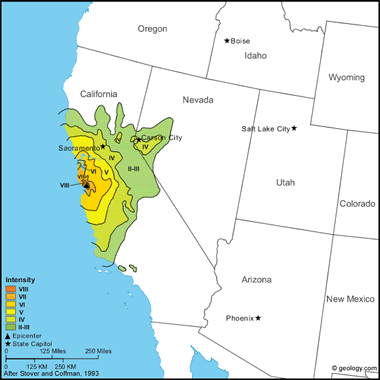
Santa Cruz Mountains Earthquake, 1989: This major earthquake caused 63 deaths, 3,757 injuries, and an estimated $6 billion in property damage. It was the largest earthquake to occur on the San Andreas fault since the great San Francisco earthquake in April 1906.
The most severe property damage occurred in Oakland and San Francisco, about 100 km north of the fault segment that slipped on the San Andreas. MM intensity IX was assigned to San Francisco's Marina District, where several houses collapsed, and to four areas in Oakland and San Francisco, where reinforced-concrete viaducts collapsed: Nimitz Freeway (Interstate 880) in Oakland, and Embarcadero Freeway, Highway 101, and Interstate 280 in San Francisco. Communities sustaining heavy damage in the epicentral area included Los Gatos, Santa Cruz, and Watsonville.
Liquefaction, as evidenced by sand boils, lateral spreading, settling, and slumping, occurred as far as 110 kilometers from the epicenter. It caused severe damage to buildings in San Francisco's Marina district as well as along the coastal areas of Oakland and Alameda in the east San Francisco Bay shore area. Liquefaction also contributed significantly to the property damage in the Santa Cruz and Monterey Bay areas, which lie near the epicentral zone. Structures damaged by liquefaction include buildings, bridges, highways, pipelines, port facilities, airport runways, and levees. Subsurface soil conditions, which amplified accelerations in the San Francisco Bay area, strongly influenced structural damage patterns and probably contributed to liquefaction problems in loose, sandy fills underlain by deep, cohesive soil deposits.
Engineered buildings, including those near the epicenter, performed well during the earthquake. Hospital buildings in the region sustained only minor system and cosmetic damage, and operational interruptions did not occur. Only five schools sustained severe damage, estimated at $81 million.
Most of the spectacular damage to buildings was sustained by unreinforced masonry buildings constructed of wood-frame roof and floor systems supported by unreinforced brick walls. These structures failed in areas near the epicenter as well as in areas far from the epicenter, at San Francisco and Monterey. The severe shaking near Santa Cruz caused heavy damage to the unreinforced masonry buildings in that area, particularly in the Santa Cruz Pacific Garden Mall, which consisted of several blocks of unreinforced masonry store buildings.
More than 80 of the 1,500 bridges in the area sustained minor damage, 10 required temporary supports, and 10 were closed owing to major structural damage. One or more spans collapsed on three bridges. The most severe damage occurred to older structures on poor ground, such as the Cypress Street Viaduct (41 deaths) and the San Francisco-Oakland Bay Bridge (one death). Damage to the transportation system was estimated at $1.8 billion.
Most of the more than 1,000 landslides and rockfalls occurred in the epicentral zone in the Santa Cruz Mountains. One slide, on State Highway 17, disrupted traffic for about 1 month.
The earthquake produced a pattern of northwest-trending extensional fractures in the north end of the aftershock zone northwest of the epicenter, but throughgoing right-lateral surface faulting was not found above the rupture defined by the main shock and its aftershocks. Six feet of right-lateral strike-slip and 4 feet of reverse-slip was inferred from geodetic data. The only surface fracturing that might be attributed to primary tectonic faulting occurred along a trace of the San Andreas near Mount Madonna Road in the Corralitos area, where en echelon cracks showed 2 centimeters of right-lateral displacement.
Extensional fractures (maximum net displacement of 92 centimeters) were observed about 12 kilometers northwest of the epicenter, in the Summit Road-Skyland Ridge area, east of State Highway 17, whereas zones of compressional deformation were found along the northeast foot of the Santa Cruz Mountains between Blossom Hill and Palo Alto. In Los Altos and Los Gatos, ground deformation appeared to be associated closely with zones of heavy structural damage and broken underground utility lines.
Other towns in the area that also experienced severe property damage include Boulder Creek, Corralitos, Hollister, Moss Landing, and several smaller communities in the Santa Cruz Mountains.
This earthquake was felt over most of central California and in part of western Nevada. The rate of aftershock activity decreased rapidly with time, but the total number of aftershocks was less than that expected from a generic California earthquake of similar magnitude. Fifty-one aftershocks of magnitude 3.0 and larger occurred during the first day after the main shock, and 16 occurred during the second day. After 3 weeks, 87 magnitude 3.0 and larger aftershocks had occurred. (from: United States Geological Survey Professional Paper 1527: Seismicity of the United States, 1568-1989, (revised), by C.W. Stover and J.L. Coffman, 1993, 418 pages) Larger map
| San Bernardino Earthquake - 6.4 - April 10, 1947 |
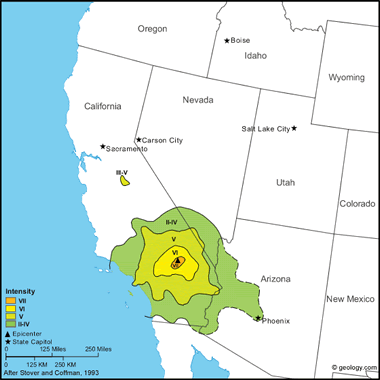
San Bernardino Earthquake, 1947: This moderate shock was strongest in the Newberry Springs area, about 40 kilometers east of Barstow. One schoolhouse was condemned at Newberry Springs, and three adobe and brick houses were damaged severely. Minor damage, including one toppled chimney, fallen walls, cracks in chimneys and concrete, and cracked and slumped highways, were reported in the area. Also, cracks formed in the banks of the Mojave River. Felt over most of the southern half of California, a small part of southwest Nevada, and at several towns in western Arizona. Several light aftershocks occurred. (from: United States Geological Survey Professional Paper 1527: Seismicity of the United States, 1568-1989, (revised), by C.W. Stover and J.L. Coffman, 1993, 418 pages) Larger map
| More Earthquakes |
 |
What is the San Andreas Fault? |
 |
What Causes a Tsunami? |
 |
Largest Earthquake |
 |
California Earthquake Maps |
 |
Teaching Plate Tectonics |
 |
Earthquake Lessons |
 |
Gifts That Rock |
 |
The Japan Earthquake |

Find Other Topics on Geology.com:

|

| ||

|

| ||

|

| ||

|
|
