Home » General Geology » What is a Hydrograph?
What is a Hydrograph?
Article by: Hobart M. King, PhD, RPG
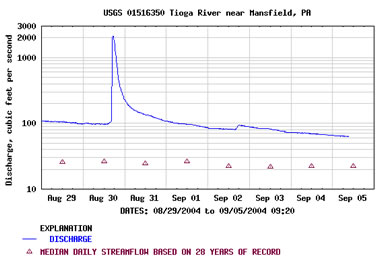
Stream discharge hydrograph. Enlarge graph.
Hydrographs are charts that display the change of a hydrologic variable over time. Here are several examples from the US Geological Survey's gaging station on the Tioga River near Mansfield, Pennsylvania. Although these examples are from a stream, hydrographs can also be made for lakes, water wells, springs and other bodies of water.
Stream Discharge Hydrograph
This is one of the most frequently created hydrographs. It shows the change in discharge of a stream over time. The blue line on the hydrograph above shows how the discharge of the Tioga River changed between August 29 and September 5, 2004. A rainfall event in the late afternoon of August 30th produced about 1/4 inch of rain in the area of the gage. However, over one inch of rain fell in less than 15 minutes just a couple miles from the gaging station. Runoff from this precipitation caused the Tioga's discharge to rapidly increase from about 100 cubic feet per second to over 2000 cubic feet per second.
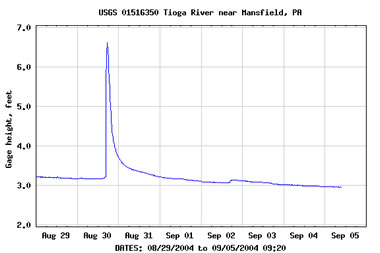
Stream stage hydrograph. Enlarge graph.
Stream Stage Hydrograph
A stream stage hydrograph shows how the height of the water above a reference datum has changed over time. Because the discharge of a stream is related to its stage, stage hydrographs and discharge hydrographs have very similar shapes.
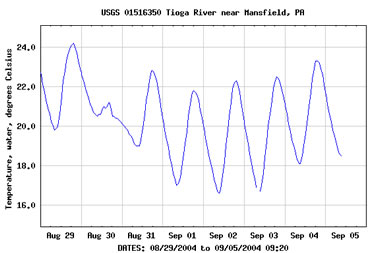
Water temperature hydrograph. Enlarge graph.
Water Temperature Hydrograph
A water temperature hydrograph shows how the temperature of the stream's water has changed over time. This water temperature hydrograph shows a daily cycle of temperature from solar heating. When the morning sun begins heating the land, stream, and atmosphere, the water temperature begins to increase. This temperature increase continues through the day and reaches a maximum near sunset. Temperatures drop through the night, and the cycle begins again the next morning. In this hydrograph, notice how the daily temperature cycle was interrupted on August 30th. The cold precipitation/runoff lowered the water temperature and eliminated the daily temperature rise.
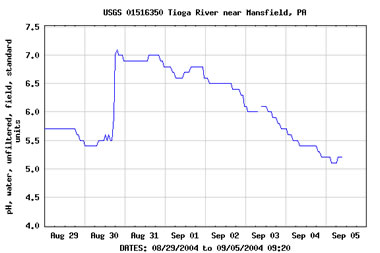
pH hydrograph. Enlarge graph.
pH Hydrograph
A pH hydrograph shows how the pH of the stream has changed over time. The pH of the Tioga River at this location is generally below 7.0. This low pH is caused by acid mine drainage entering the river at several locations upstream. The sharp increase in pH on August 30 was caused by the large amount of precipitation/runoff (probably with pH of about 7.0) entering the stream. The increased pH level slowly fell over the next few days as runoff and bank storage produced by the rainstorm slowly left the drainage area.
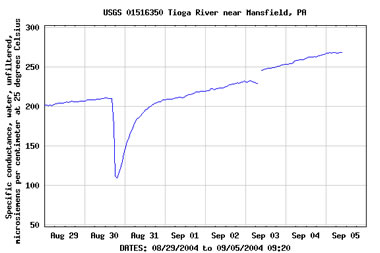
Specific conductance hydrograph. Enlarge graph.
Specific Conductance Hydrograph
Specific conductance is a measure of the ability of water to carry an electric current. This ability is proportional to the quantity of ions dissolved in the water. If you study this specific conductance hydrograph and compare it to the discharge hydrograph, you should conclude that the concentration of dissolved ions is inversely proportional to the discharge of the stream. Precipitation and runoff entering the river on August 30th diluted the concentration of dissolved ions, resulting in a sharp decrease in specific conductance. The specific conductance slowly rose through the rest of the week as runoff and bank storage water left the drainage area, and baseflow (with its high concentration of dissolved ions) began contributing a greater percentage of the stream's discharge.
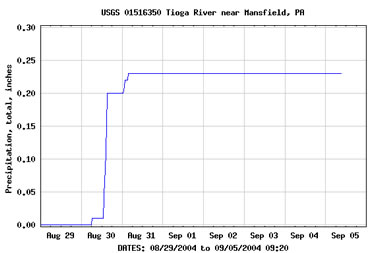
Precipitation hydrograph. Enlarge graph.
Precipitation Hydrograph
A record of precipitation over time can also be plotted as a hydrograph. The precipitation hydrograph shown is a cumulative record of precipitation at the Tioga River gaging station between August 29th and September 5th. Rainfall events are clearly shown by sharp increases of the blue line.
Where Can You Get Hydrographs for Streams Near Your Home?
The United States Geological Survey has thousands of stream gaging stations located across the United States. Many of these gaging stations transmit their data to USGS continuously, and that data is published to the web. Read our article on stream gaging stations to learn more about this network and how you can obtain hydrograph data for streams near your home.
| More General Geology |
 |
Fossils |
 |
Igneous and Volcanic Features |
 |
Geology Dictionary |
 |
Diamonds |
 |
Minerals |
 |
Divisions of Geologic Time |
 |
Land Below Sea Level |
 |
Gifts That Rock |

Find Other Topics on Geology.com:
|
| ||
|
| ||
|
| ||
|
|