Home » Oil and Gas » Eagle Ford Shale
Eagle Ford Shale
Hydraulic fracturing and horizontal drilling have made the Eagle Ford and several associated rock units
one of the most prolific oil-producing targets in the United States.
Article by: Hobart M. King, PhD, RPG
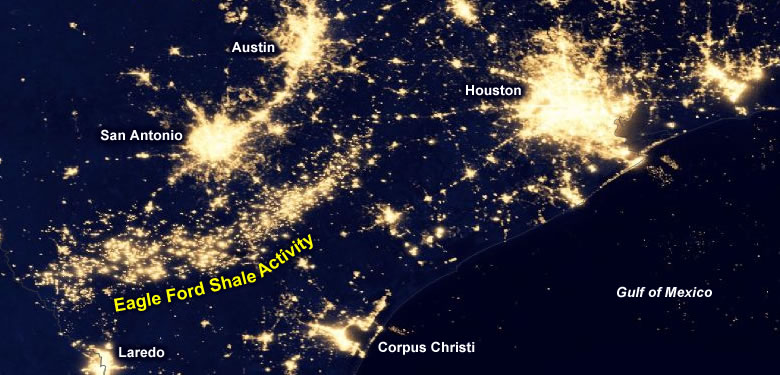
Eagle Ford Shale: This is a "night lights" image of southeast Texas from NASA's Suomi satellite. The brightest spots in this image are the cities of Austin, San Antonio, Houston, Corpus Christi, and Laredo. The crescent-shaped scatter of lights south of San Antonio is the area where the Eagle Ford Shale is being heavily drilled. Night light there is a combination of electric illumination of drilling pads and natural gas flaring at some drilling sites. Flaring is the practice of burning natural gas at well sites when pipelines are not available to transport the gas to market. Image from our "Oil and Gas Fields at Night" collection.
Map of the Eagle Ford Shale Oil and Gas Play: The green area on this map marks the geographic extent of drilling activity in the Eagle Ford Shale natural gas and oil play. Wells drilled within this area using horizontal drilling and hydraulic fracturing have typically been successful.
What is the Eagle Ford Shale?
The Eagle Ford Shale (also known as the Eagle Ford Formation) is a black calcareous shale with a high organic carbon content that underlies much of southeastern Texas. In some parts of the area underlain by the Eagle Ford Shale, heat and pressure have converted organic material within the shale into oil and natural gas. Between 2008 and the present, the Eagle Ford Shale has become one of the most heavily drilled rock units in the United States. The area with active drilling is shown in green on the accompanying map.
Generalized Stratigraphic Section: This illustration shows the geologic units in the subsurface of the Texas Gulf Coast region. The Eagle Ford Formation is late Cretaceous in age and is shown in this section with its lateral equivalents, the Woodbine Formation and the Tuscaloosa Group. Image by the United States Geological Survey.
Update: Stacked Pay ZonesAlthough the Eagle Ford Shale is a relatively recent development, rock units above and below the Eagle Ford Shale have a long history of oil and gas interest. Oil and gas have been produced above the Eagle Ford from the Olmos Formation and the Austin Chalk. Below the Eagle Ford, production has been from the Buda Limestone, the Edwards Limestone, and the Pearsall Shale. These rock units are shown in the stratigraphic column on this page. Today, drillers are starting to use horizontal drilling and/or hydraulic fracturing to tap these rock units. Some recently drilled wells in the Buda Lime and Austin Chalk are producing more than 1000 barrels of oil per day. The stacked production zones in a single location provide enormous economic savings. Oil can be produced from multiple rock units using the same drill pad, access roads, and oil collection systems. All of this production concentrated in the same area also makes pipelines more profitable. |
United States Dry Shale Gas Production: The graph above shows the growth of dry shale gas production in the United States, color-coded by rock unit, since calendar year 2005. The Eagle Ford Shale is shown in light blue.
Oil and Natural Gas History
The Eagle Ford received very little attention from oil and gas companies prior to 2008. It was known to contain significant amounts of hydrocarbon and was thought to be the source rock for much of the oil and natural gas produced from rock units above it such as the Austin Chalk. However, the Eagle Ford itself was not known as an oil or natural gas producer. The rock unit had such a low permeability that oil and natural gas could not flow through the rock into a production well.
This changed in 2008 when Petrohawk drilled an Eagle Ford well in La Salle County that had an initial flow rate of 7.6 million cubic feet of natural gas per day. This well demonstrated that hydraulic fracturing and horizontal drilling could be used to produce gas from the Eagle Ford Shale. These were the same techniques used by Mitchell Energy to develop the Barnett Shale in the Fort Worth Basin.
After Petrohawk's success, drilling companies began to use hydraulic fracturing to induce fractures in the Eagle Ford Shale at many locations. The fractures facilitate the flow of natural gas and oil out of the rock and into the well. Companies also use horizontal drilling in their development wells. With this method they drill a vertical well down to the rock unit, steer the well to horizontal, and drill a "pay zone" of up to two miles in length through the high organic portion of the rock formation. The horizontal leg is then stimulated with hydraulic fracturing. This combination unlocked the potential of the Eagle Ford Shale. Wells developed with horizontal drilling and hydraulic fracturing usually yield much more oil and gas than a standard vertical well that only penetrates a few hundred feet of pay zone.
Early wells in the Eagle Ford Formation were so productive that leasing and drilling activities proceeded at a very rapid rate. This attracted an enormous amount of media attention between 2008 and 2010 as landmen were out leasing mineral rights, drilling companies were applying for permits, and oil and gas production was rising rapidly. The Eagle Ford Shale very quickly became one of the most heavily drilled rock units in the United States.
Graphs of drilling permits issued, oil production, natural gas production, and condensate production can be seen below.
Eagle Ford Shale Oil Production: This graph illustrates the average oil production from the Eagle Ford Shale in barrels per day. Prior to 2010, the production focus for the Eagle Ford was natural gas. Then, as the focus shifted to the more profitable oil portion of the play, the oil production rate exploded. Graph prepared using data from the Texas Railroad Commission.
Eagle Ford Shale Drilling Permits Issued by Calendar Year: Drilling permit activity exploded in 2010, with over 1000 permits issued for the Eagle Ford Formation. The number of permits issued per year increased dramatically until 2015. Graph prepared using data from the Texas Railroad Commission.
Eagle Ford Shale Condensate Production: This graph illustrates the average daily condensate production from the Eagle Ford Shale in barrels per day. Graph prepared using data from the Texas Railroad Commission.
Eagle Ford Shale Natural Gas Production: This graph illustrates the average natural gas production from the Eagle Ford Shale in millions of cubic feet per day. Prior to 2008, very little gas was produced from the rock unit. Then in 2010, the production rate began to increase rapidly. Graph prepared using data from the Texas Railroad Commission.
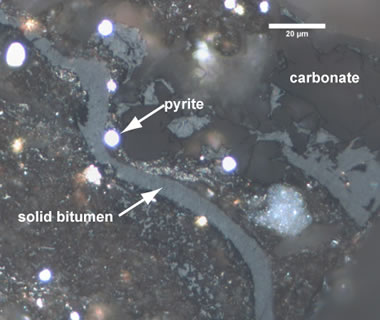
Eagle Ford Shale photomicrograph: This is a photograph of the Eagle Ford Shale taken through a reflected light microscope. It shows a dark, organic-stained clay matrix with significant amounts of solid bitumen, carbonate minerals, and pyrite. Photo by the USGS Organic Petrology Laboratory.
Petrology of the Eagle Ford Shale
As with most rocks of regional extent, the Eagle Ford Shale has a wide variety of characters. In the area where it is productive, the Eagle Ford is typically a laminated, black, calcareous, organic-rich shale with a very low permeability. This portion of the Eagle Ford is thought to have been deposited in low-energy marine waters that were far enough from shore and deep enough to avoid wave disturbance.
The black, organic-rich nature of the shale, along with its high degree of lamination, suggests anoxic waters that protected the organic material from decay and the laminations from bioturbation. Its dark color is attributed to its organic content. Where its carbonate content is high, the shale can be relatively brittle. This brittle nature is likely responsible for the positive response of the shale to hydraulic fracturing.
Eagle Ford Shale Structure Map: Outcrop area of the Eagle Ford Shale is shown in black on the map above. This rock unit dips towards the southeast, and it becomes deeper as it approaches the Gulf of Mexico. This increasing depth of burial has exposed the shale to heat and pressure that has matured the organic material in the shale into oil and natural gas. The potential drilling area of the Eagle Ford Shale is shown in green above along with the depth of the formation in feet below sea level. Map prepared using data from the United States Energy Information Administration.
Productive Eagle Ford Oil and Gas Wells: This map shows hydrocarbon zones within the Eagle Ford Shale drilling area. The green areas are where well production has typically been limited to natural gas. Wells in the yellow area typically yield both oil and gas. Wells in the red areas typically yield oil. Map prepared using data from the Energy Information Administration.
Eagle Ford Shale Structure and Thickness
The Eagle Ford Shale is Cretaceous in age. In its productive area it ranges from 50 to 400 feet thick and occurs in the Texas subsurface below the Austin Chalk and above the Buda Limestone. In other areas the Eagle Ford can be over 1000 feet thick.
Between the outcrop area and the Gulf of Mexico, the Eagle Ford Shale dips steeply into the subsurface and reaches depths of over 14,000 feet below sea level. Most of the current production is coming from areas where the Eagle Ford is between 4,000 feet below sea level and 14,000 feet below sea level. (See generalized cross section below and a structure contour map on this page.)
The presence of oil and natural gas production within the Eagle Ford Shale is related to burial depth. At depths of about 4000 feet, the shale has been exposed to sufficient heat and pressure to convert some of the organic material into oil. At greater depths natural gas is formed. At depths greater than about 14,000 feet, the heat and pressure are great enough to have destroyed oil and natural gas. This explains the geographic distribution of oil and natural gas production shown in the map.
Eagle Ford Shale Generalized Cross Section: The diagram above shows how the Eagle Ford Shale dips steeply into the subsurface between its outcrop (location A) and the southwestern edge of the play (location B).
| Eagle Ford Shale References |
|
Eagle Ford Shale Information Page: Texas Railroad Commission.
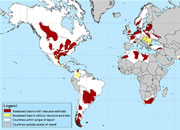
Eagle Ford Shale Play Map: Energy Information Administration. Assessment of Undiscovered Oil and Gas Resources in Jurassic and Cretaceous Strata of the Gulf Coast, 2010: Russell F. Dubiel, Peter D. Warwick, Sharon Swanson and others, United States Geological Survey Fact Sheet 2011-3020. Organic Materials in Shale: United States Geological Survey Photomicrograph Atlas. |
New Technologies are Being Developed
The Eagle Ford Shale and associated rock units have quickly become one of the most successful oil and gas areas of the United States. The technologies needed to develop production from the limestones are different from what is needed to develop the shales. These methods are being refined and should become more efficient and productive as drillers gain experience. The focus is now on the Eagle Ford, but these other rock units will be there when the Eagle Ford begins to deplete or when new technologies are ready.
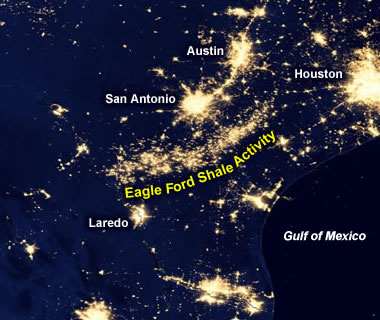
Eagle Ford lights: A zoomed-out view of the satellite image displayed at the top of this article. The footprint of drilling activity in the Eagle Ford oil and gas trend during 2012 is clearly outlined as an arc of light north of Laredo and south of San Antonio. Note how the trend of light ends at the border between Texas and Mexico.
An Oil & Gas Bonanza for Mexico?
The accompanying satellite image of night-time electric illumination and flaring effectively shows how the footprint of Eagle Ford drilling activity ended abruptly at the border between Texas and Mexico between April and October, 2012 - the time interval during which the data to produce the image was acquired. The rocks of the Eagle Ford formation do not honor this border - they extend into Mexico and have a high development potential.
Oil and gas development ended at the international border in 2012 because at that time Mexico did not have the technology or financial backing to develop the resource. The U.S. Energy Information Administration reports that the Eagle Ford is the best documented shale play in Mexico. Rock units in northern Mexico contain an estimated 343 trillion cubic feet of natural gas and 6.3 billion barrels of oil. Mexico has numerous other potential oil and gas plays in shale.
| More Oil |
 |
Horizontal Drilling |
 |
Oil and Gas Rights |
 |
Shale Gas Resources |
 |
Gifts That Rock |
 |
What is LNG? |
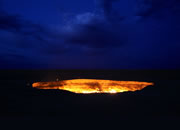 |
The Doorway to Hell |
 |
Natural Gas Investing |
 |
Helium |

Find Other Topics on Geology.com:
|
| ||

|

| ||

|

| ||

|
|