Home » Oil and Gas » World Shale Gas Resources
World Shale Gas Resources
Republished from An Initial Assessment of 14 Regions Outside the United States by the Energy Information Administration
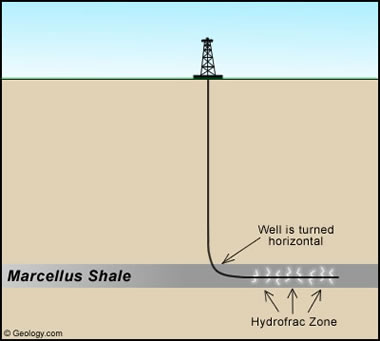
Shale Gas Well: The use of horizontal drilling in conjunction with hydraulic fracturing has greatly expanded the ability of producers to profitably produce natural gas from low-permeability geologic formations, particularly shale formations.
What Triggered the U.S. Shale Gas Revolution?
The use of horizontal drilling in conjunction with hydraulic fracturing has greatly expanded the ability of producers to profitably produce natural gas from low-permeability geologic formations, particularly shale formations. Application of fracturing techniques to stimulate oil and gas production began to grow rapidly in the 1950s, although experimentation dates back to the 19th century.
Starting in the mid-1970s, a partnership of private operators, the U.S. Department of Energy and the Gas Research Institute endeavored to develop technologies for the commercial production of natural gas from the relatively shallow Devonian (Huron) shale in the Eastern United States. This partnership helped foster technologies that eventually became crucial to producing natural gas from shale rock, including horizontal wells, multi-stage fracturing, and slick-water fracturing. [1]
Horizontal Drilling Technology
Practical application of horizontal drilling to oil production began in the early 1980s, by which time the advent of improved downhole drilling motors and the invention of other necessary supporting equipment, materials, and technologies, particularly downhole telemetry equipment, had brought some applications within the realm of commercial viability. [2]
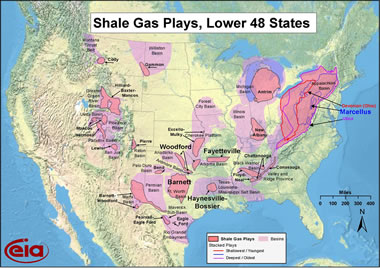
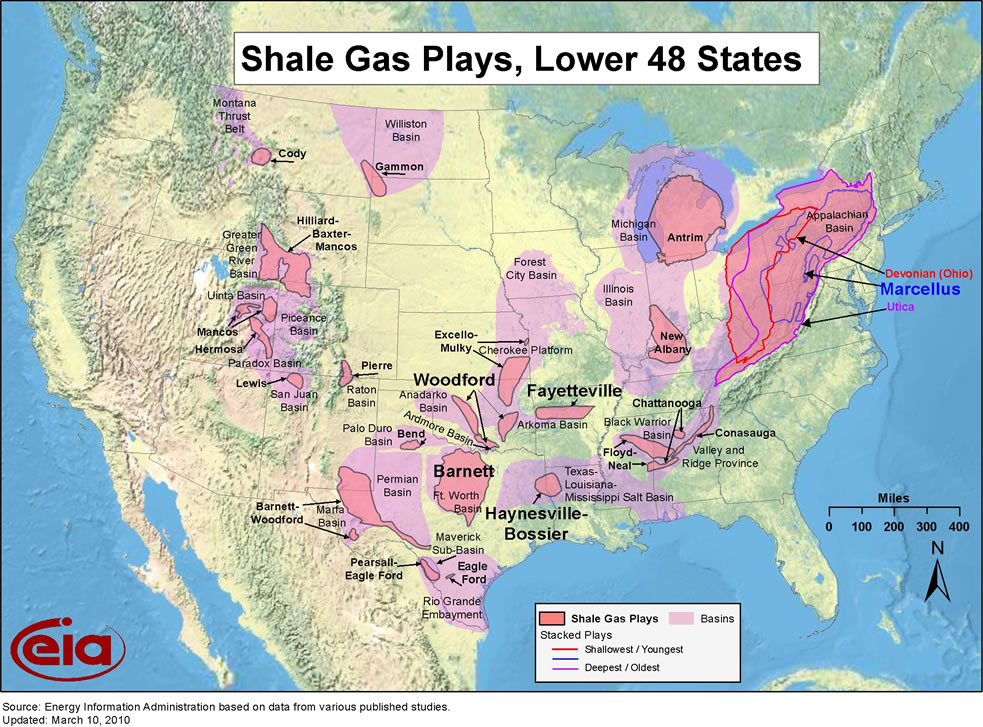
Shale gas plays: Map of the major shale gas plays in the lower 48 states, including the sedimentary basins which contain them. Enlarge map.
The Work of Mitchell Energy and Development
The advent of large-scale shale gas production did not occur until Mitchell Energy and Development Corporation experimented during the 1980s and 1990s to make deep shale gas production a commercial reality in the Barnett Shale in North-Central Texas. As the success of Mitchell Energy and Development became apparent, other companies aggressively entered this play so that by 2005, the Barnett Shale alone was producing almost half a trillion cubic feet per year of natural gas. As natural gas producers gained confidence in the ability to profitably produce natural gas in the Barnett Shale and confirmation of this ability was provided by the results from the Fayetteville Shale in North Arkansas, they began pursuing other shale formations, including the Haynesville, Marcellus, Woodford, Eagle Ford and other shales.
The Natural Gas "Game Changer"
The development of shale gas plays has become a "game changer" for the U.S. natural gas market. The proliferation of activity into new shale plays has increased shale gas production in the United States from 0.39 trillion cubic feet in 2000 to 4.87 trillion cubic feet in 2010, or 23 percent of U.S. dry gas production. Shale gas reserves have increased to about 60.6 trillion cubic feet by year-end 2009, when they comprised about 21 percent of overall U.S. natural gas reserves, now at the highest level since 1971. [3]
The growing importance of U.S. shale gas resources is also reflected in EIA's Annual Energy Outlook 2011 (AEO2011) energy projections, with technically recoverable U.S. shale gas resources now estimated at 862 trillion cubic feet. Given a total natural gas resource base of 2,543 trillion cubic feet in the AEO2011 Reference case, shale gas resources constitute 34 percent of the domestic natural gas resource base represented in the AEO2011 projections and 50 percent of lower 48 onshore resources. As a result, shale gas is the largest contributor to the projected growth in production, and by 2035 shale gas production accounts for 46 percent of U.S. natural gas production.
Diffusion of Shale Gas Technologies
The successful investment of capital and diffusion of shale gas technologies has continued into Canadian shales as well. In response, several other countries have expressed interest in developing their own nascent shale gas resource base, which has lead to questions regarding the broader implications of shale gas for international natural gas markets. The U.S. Energy Information Administration (EIA) has received and responded to numerous requests over the past three years for information and analysis regarding domestic and international shale gas. EIA's previous work on the topic has begun to identify the importance of shale gas on the outlook for natural gas. [4] It appears evident from the significant investments in preliminary leasing activity in many parts of the world that there is significant international potential for shale gas that could play an increasingly important role in global natural gas markets.
To gain a better understanding of the potential of international shale gas resources, EIA commissioned an external consultant, Advanced Resources International, Inc. (ARI), to develop an initial set of shale gas resource assessments. This paper briefly describes key results, the report scope and methodology and discusses the key assumptions that underlie the results. The full consultant report prepared for EIA is in Attachment A. EIA anticipates using this work to inform other analysis and projections, and to provide a starting point for additional work on this and related topics.
Shale Gas in Worldwide Basins
| ||||||||||||||||||||||||||||||||||||||||||||||||||||||||||||||||||||||||
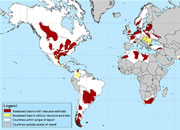
In total, the report assessed 48 shale gas basins in 32 countries, containing almost 70 shale gas formations. These assessments cover the most prospective shale gas resources in a select group of countries that demonstrate some level of relatively near-term promise and for basins that have a sufficient amount of geologic data for resource analysis. The map at the top of this page shows the location of these basins and the regions analyzed. The map legend indicates four different colors on the world map that correspond to the geographic scope of this initial assessment:
Red colored areas represent the location of assessed shale gas basins for which estimates of the 'risked' gas-in-place and technically recoverable resources were provided.
Yellow colored area represents the location of shale gas basins that were reviewed, but for which estimates were not provided, mainly due to the lack of data necessary to conduct the assessment.
White colored countries are those for which at least one shale gas basin was considered for this report.
Gray colored countries are those for which no shale gas basins were considered for this report.
The International Shale Gas Resource Base
Although the shale gas resource estimates will likely change over time as additional information becomes available, the report shows that the international shale gas resource base is vast. The initial estimate of technically recoverable shale gas resources in the 32 countries examined is 5,760 trillion cubic feet, as shown in Table 1. Adding the U.S. estimate of the shale gas technically recoverable resources of 862 trillion cubic feet results in a total shale resource base estimate of 6,622 trillion cubic feet for the United States and the other 31 countries assessed.
To put this shale gas resource estimate in some perspective, world proven reserves [5] of natural gas as of January 1, 2010 are about 6,609 trillion cubic feet, [6] and world technically recoverable gas resources are roughly 16,000 trillion cubic feet, [7] largely excluding shale gas. Thus, adding the identified shale gas resources to other gas resources increases total world technically recoverable gas resources by over 40 percent to 22,600 trillion cubic feet.
| References for World Shale Gas |
|
[1] G.E. King, Apache Corporation, "Thirty Years of Gas Shale Fracturing: What Have We Learned?", prepared for the SPE Annual Technical Conference and Exhibition (SPE 133456), Florence, Italy, (September 2010); and U.S. Department of Energy, DOE's Early Investment in Shale Gas Technology Producing Results Today, (February 2011).
[2] See: U.S. Energy Information Administration, "Drilling Sideways: A Review of Horizontal Well Technology and Its Domestic Application", DOE/EIA-TR-0565 (April 1993). [3] U.S. Crude Oil, Natural Gas, and Natural Gas Liquids Proved Reserves, 2009: U.S. Energy Information Administration. [4] Examples of EIA work that has spurred or resulted from interest in this topic includes: U.S. Energy Information Administration, AEO2011 Early Release Overview (Dec 2010); R. Newell, U.S. Energy Information Administration, "Shale Gas, A Game Changer for U.S. and Global Gas Markets?", presented at the Flame - European Gas Conference, Amsterdam, Netherlands (March 2, 2010); H. Gruenspecht, U.S. Energy Information Administration, "International Energy Outlook 2010 With Projections to 2035", presented at Center for Strategic and International Studies, Washington, D.C. (May 25, 2010); and R. Newell, U.S. Energy Information Administration, "The Long-term Outlook for Natural Gas", presented to the Saudi Arabia - United States Energy Consultations, Washington, D.C. (February 2, 2011). [5] Reserves refer to gas that is known to exist and is readily producible, which is a subset of the technically recoverable resource base estimate for that source of supply. Those estimates encompass both reserves and that natural gas which is inferred to exist, as well as undiscovered, and can technically be produced using existing technology. For example, EIA's estimate of all forms of technically recoverable natural gas resources in the U.S. for the Annual Energy Outlook 2011 is 2,552 trillion cubic feet, of which 827 trillion cubic feet consists of unproved shale gas resources and 245 trillion cubic feet are proved reserves which consist of all forms of readily producible natural gas including 34 trillion cubic feet of shale gas. [6] "Total reserves, production climb on mixed results," Oil and Gas Journal (December 6, 2010), pp. 46-49. [7] Includes 6,609 trillion cubic feet of world proven gas reserves (Oil and Gas Journal 2010); 3,305 trillion cubic feet of world mean estimates of inferred gas reserves, excluding the Unites States (USGS, World Petroleum Assessment 2000); 4,669 trillion cubic feet of world mean estimates of undiscovered natural gas, excluding the United States (USGS, World Petroleum Assessment 2000); and U.S. inferred reserves and undiscovered gas resources of 2,307 trillion cubic feet in the United States, including 827 trillion cubic feet of unproved shale gas (EIA, AEO2011). [8] The Department of State is the lead agency for the GSGI, and the other U.S. government agencies that also participate include: the U.S. Agency for International Development (USAID); the Department of Interior's U.S. Geological Survey (USGS); Department of Interior's Bureau of Ocean Energy Management, Regulation, and Enforcement (BOEMRE); the Department of Commerce's Commercial Law Development Program (CLDP); the Environmental Protection Agency (EPA), and the Department of Energy's Office of Fossil Energy (DOE/FE). |
Conservative Basin Estimates
The estimates of technically recoverable shale gas resources for the 32 countries outside of the United States represents a moderately conservative 'risked' resource for the basins reviewed. These estimates are uncertain given the relatively sparse data that currently exist and the approach the consultant has employed would likely result in a higher estimate once better information is available. The methodology is outlined below and described in more detail within the attached report, and is not directly comparable to more detailed resource assessments that result in a probabilistic range of the technically recoverable resource. At the current time, there are efforts underway to develop more detailed shale gas resource assessments by the countries themselves, with many of these assessments being assisted by a number of U.S. federal agencies under the auspices of the Global Shale Gas Initiative (GSGI) which was launched in April 2010. [8]
Highly Dependent Countries
Delving deeper into the results at a country level, there are two country groupings that emerge where shale gas development may appear most attractive. The first group consists of countries that are currently highly dependent upon natural gas imports, have at least some gas production infrastructure, and their estimated shale gas resources are substantial relative to their current gas consumption. For these countries, shale gas development could significantly alter their future gas balance, which may motivate development. Examples of countries in this group include France, Poland, Turkey, Ukraine, South Africa, Morocco, and Chile. In addition, South Africa's shale gas resource endowment is interesting as it may be attractive for use of that natural gas as a feedstock to their existing gas-to-liquids (GTL) and coal-to-liquids (CTL) plants.
Countries with a Natural Gas Infrastructure
The second group consists of those countries where the shale gas resource estimate is large (e.g., above 200 trillion cubic feet) and there already exists a significant natural gas production infrastructure for internal use or for export. In addition to the United States, notable examples of this group include Canada, Mexico, China, Australia, Libya, Algeria, Argentina, and Brazil. Existing infrastructure would aide in the timely conversion of the resource into production, but could also lead to competition with other natural gas supply sources. For an individual country the situation could be more complex.
| More Oil |
 |
The Doorway to Hell |
 |
Oil Sands |
 |
Shale Gas Resources |
 |
Gifts That Rock |
 |
Horizontal Drilling |
 |
Oil and Gas Rights |
 |
Natural Gas Prices |
 |
Oil Shale |

Find Other Topics on Geology.com:
|
| ||

|

| ||
|

| ||

|
|