Home » Geologic Hazards » World Lightning Map
World Lightning Map
Lightning is not uniformly distributed across the Earth.
Article by: Hobart M. King, PhD
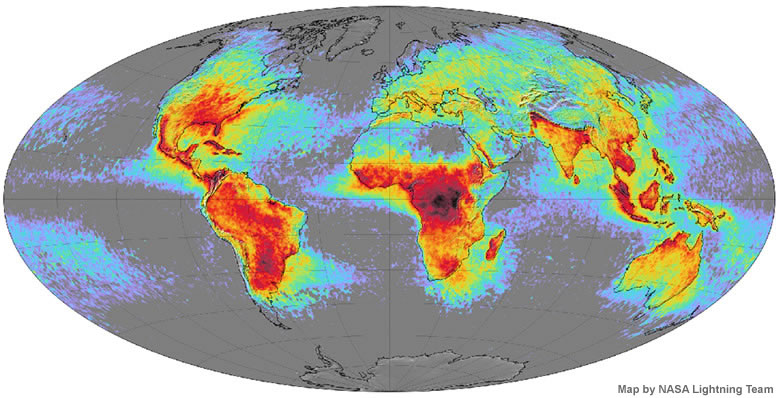
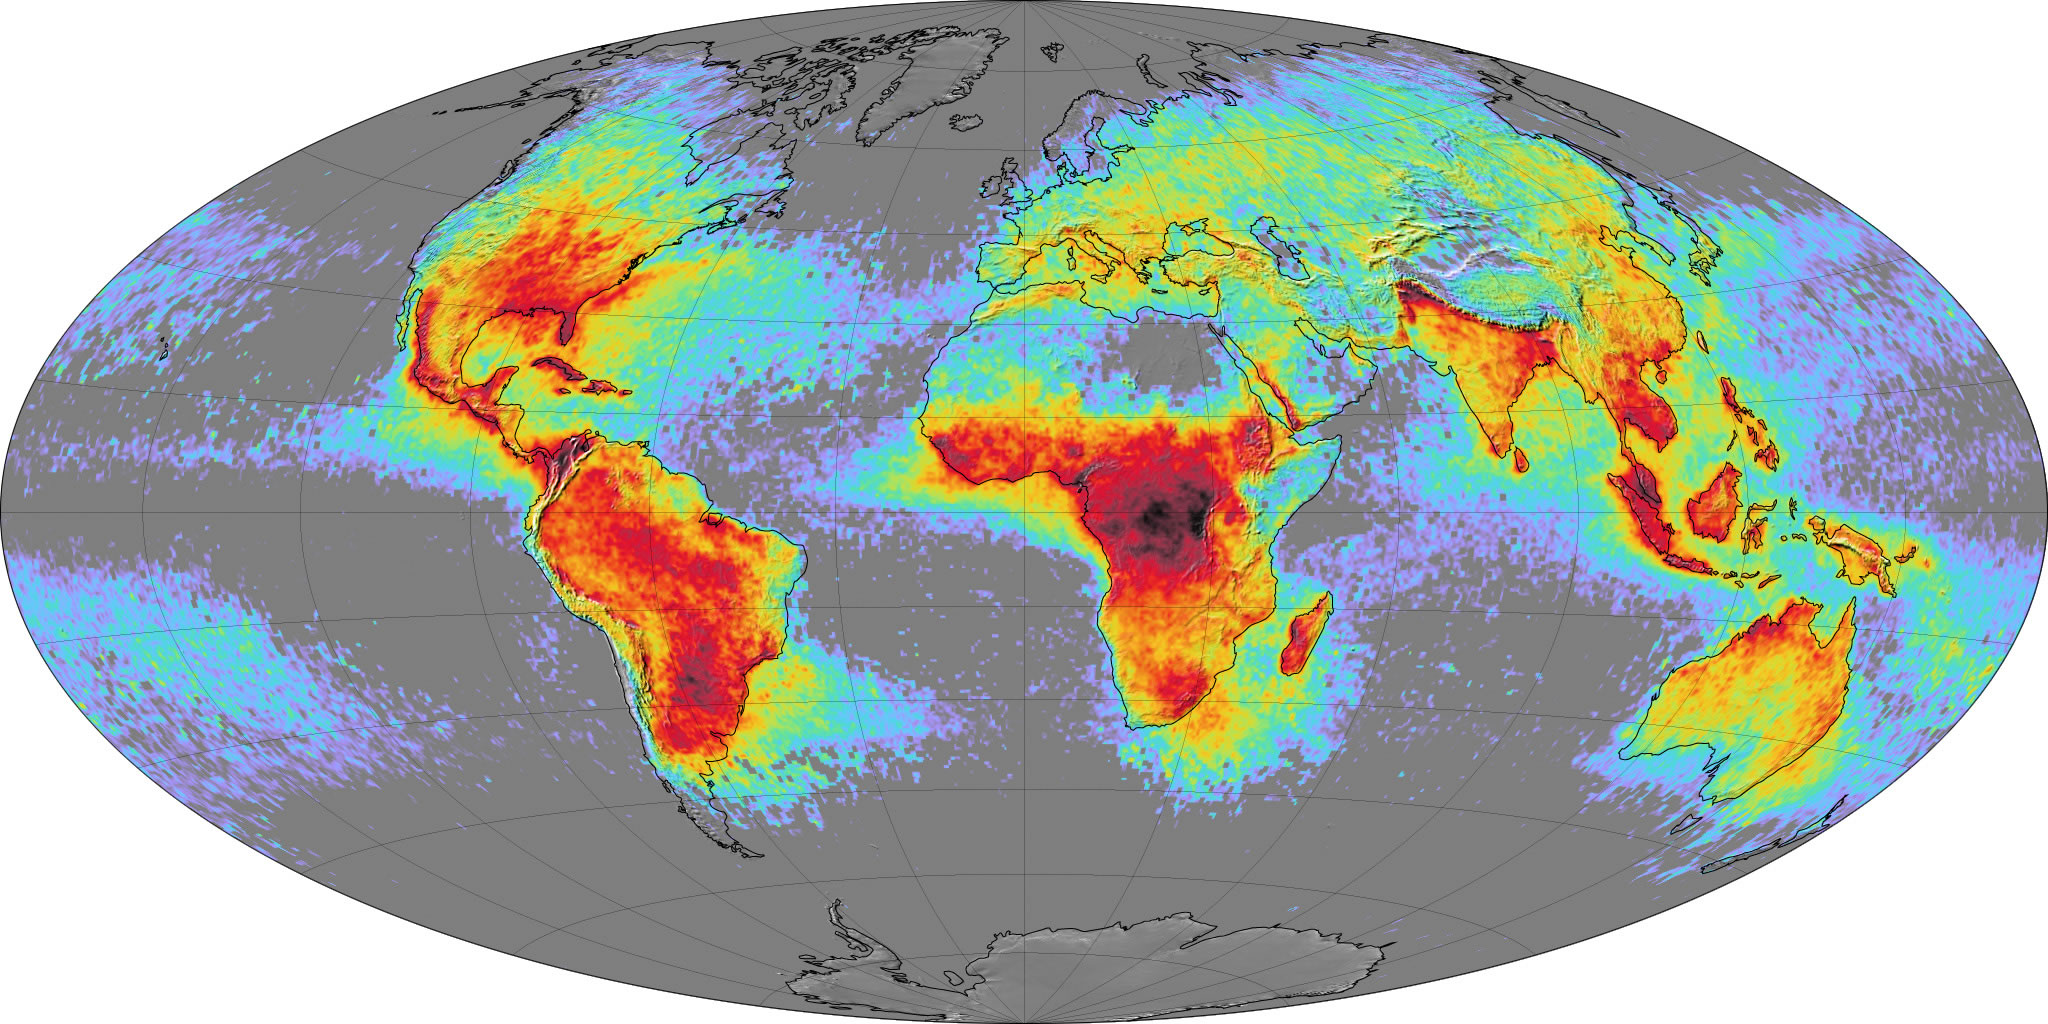
World Lightning Map: The map above shows the average yearly counts of lightning flashes per square kilometer based on data collected by NASA's Lightning Imaging Sensor on the Tropical Rainfall Measuring Mission satellite between 1995 and 2002. Places where less than one flash occurred (on average) each year are gray or light purple. The places with the largest number of lightning strikes are deep red, grading to black. Enlarge.
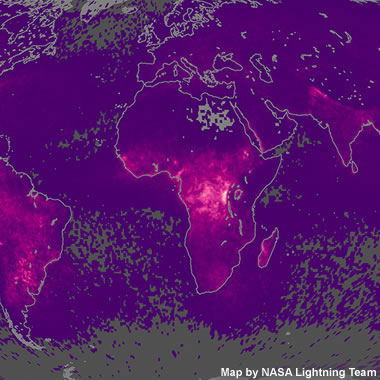
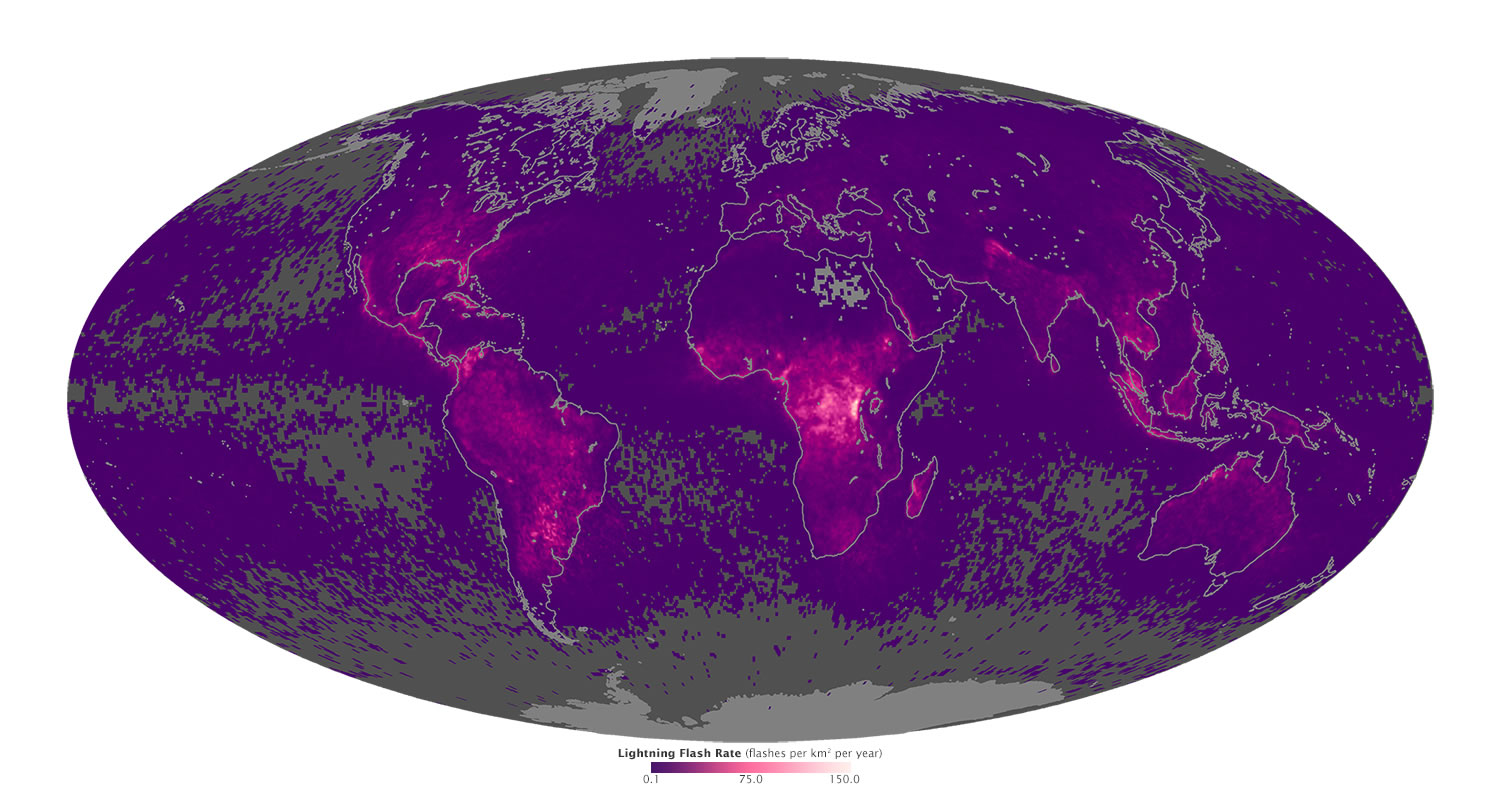
Global Lightning Activity Map: A portion of the Global Lightning Activity Map produced by NASA in 2015 using data collected between 1998 and 2013 by the Lightning Imaging Sensor on NASA's Tropical Rainfall Measuring Mission satellite. Enlarge.
What is Lightning?
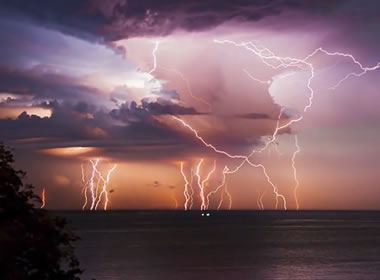
Lightning is a sudden high-voltage discharge of electricity that occurs within a cloud, between clouds, or between a cloud and the ground. Globally, there are about 40 to 50 flashes of lightning every second, or nearly 1.4 billion flashes per year. These electrical discharges are powerful and deadly.
Each year, lightning strikes kill people, livestock, and wildlife. Each year lightning is also responsible for billions of dollars in damage to buildings, communication systems, power lines, and electrical equipment. In addition, lightning costs airlines billions of dollars per year in flight rerouting and delays. For these reasons, maps that show the distribution of lightning across the Earth are important for economic, environmental, and safety reasons.
Mapping the World's Lightning Activity
The distribution of lightning on Earth is far from uniform. The ideal conditions for producing lightning and associated thunderstorms occur where warm, moist air rises and mixes with cold air above. These conditions occur almost daily in many parts of the Earth, but only rarely in other areas.
NASA has satellites orbiting the Earth with sensors designed to detect lightning. Data from these satellites is transmitted to Earth and used to construct a geographic record of lightning activity over time. The maps on this page are based upon the average yearly count of lightning flashes per unit of area. This data was plotted geographically to create the maps.
Much more lightning occurs over land than over the ocean because daily sunshine heats the land surface faster than the ocean. The heated land surface warms the air above it, and that warm air rises to encounter cold air aloft. The interaction between air masses of different temperature stimulates thunderstorms and lightning.
The maps also show that more lightning occurs near the equator than at the poles. The poles have very little lightning because their white snow- and ice-covered surfaces are not effectively warmed by the sun to produce convection. There is also very little moisture in polar air. These factors significantly reduce the amount of lightning produced near the poles.
Lake Maracaibo: The world's top lightning hotspot is over Lake Maracaibo in northwestern Venezuela. Here, nocturnal thunderstorms occur on average about 297 days per year and produce an average of about 232 lightning flashes / square kilometer / year. Local people have called this phenomenon "Relámpago del Catatumbo" (Catatumbo lightning) for hundreds of years. Image by NASA. Enlarge image.
World's Principal Lightning Hotspot
One small area in northern South America is clearly the world's principal lightning hotspot. That hotspot is located over the southern end of Lake Maracaibo, a brackish bay in northwestern Venezuela. The Lake Maracaibo Lightning Hotspot has a lightning flash rate density of 232.52. That means that the area experiences an average of 232.52 flashes of lightning per square kilometer per year.
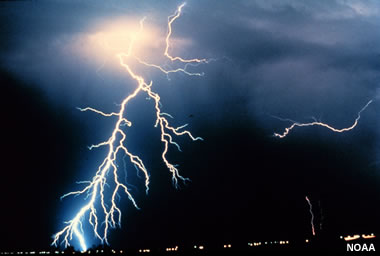
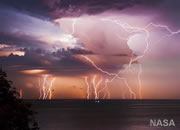
Lightning photograph: A night-time photograph of multiple cloud-to-ground and cloud-to-cloud lightning strokes. Image by NOAA.
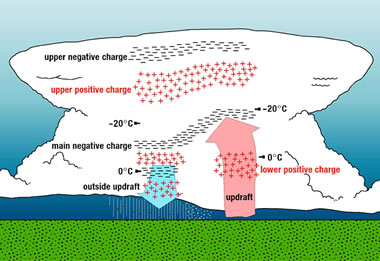
Electrical charge in storm clouds: A model of electrical charge distribution within a storm cloud. The segregation of charges contributes to the formation of lightning and causes it to flash from one location to another. Learn more about lightning at NOAA. Image by NOAA.
Regions of Intense Lightning Activity
Several broad regions on Earth experience an unusual amount of lightning. Six of these areas are listed below along with the reasons for their unusual levels of lightning activity.
- The Democratic Republic of the Congo in central Africa has the highest frequency of lightning on Earth. Year-round thunderstorms there are caused by local convection and moisture-laden air masses from the Atlantic Ocean encountering mountains as they move across the continent.
- Northwestern South America, where warm winds from the Pacific Ocean carry moisture-laden air masses up the Andes Mountains, causing cooling and thunderstorm activity.
- The Himalayan Forelands, where seasonal winds carry warm, moist air from the Indian Ocean up the front of the mountain range, causing cooling and thunderstorm activity.
- Central Florida, between Tampa and Orlando, is known as "lightning alley." There, warm, rising air pulls in sea breezes from the Atlantic Ocean and the Gulf of America.
- The Pampas of Argentina, where moist seasonal winds coming off the Atlantic Ocean in summer and spring produce violent thunderstorms.
- Indonesia, where winds from the Indian Ocean push warm, moist air up the volcanic mountain ranges of Java and Sumatra to produce thunderstorms.
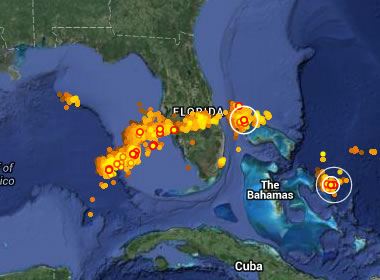
Florida lightning map: This is a map of live lightning activity over Florida Bay, the Florida Peninsula, and The Bahamas, captured on April 28, 2015 from the LightningMaps.org website. When a stroke of lightning occurs, a red circle appears on the map with concentric white bands expanding outwards. The red circle persists for 30 seconds, then fades to yellow and then to brown over the following 60 minutes before disappearing. The website allows you turn on audio that produces a snapping sound with each lightning stroke that appears on your computer screen.
Live Lightning Maps
A few websites feature live lightning activity overlain on maps or satellite images. The one that we like best is LightningMaps.org. The maps depict real-time lightning data (with only a few seconds of delay) on your computer monitor. New lighting strokes appear as a red dot, then concentric white circles spread away from them like sound waves. Within 30 seconds the red dot fades to yellow, and the yellow fades to brown and disappears within one hour. The maps allow you to see areas of the world with current storm activity and watch the storms move across Earth's surface. It is an informative and educational website. A screenshot of lightning activity over Florida is shown on this page.
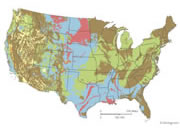
Lightning fatalities in the U.S.: A map of total lightning fatalities in the United States between 1959 and 2013. With 471 deaths, Florida has more than double the number of fatalities of any other state. Image by NOAA Media Resources.
Lightning in the United States
Lightning is the second most common storm-related killer in the United States. It causes several billion dollars in property damage each year and kills several dozen people. It is a frequent cause of wildfires and costs airlines billions of dollars per year in extra operating expenses.
Florida has the highest frequency of lightning in the United States. There, sea breezes from the Atlantic Ocean and Gulf of America converge over solar-heated land. This lifts the moist air masses that host thunderstorms. Florida is also the state with the highest number of deaths from lightning strikes. Other states along the Gulf Coast, such as Alabama, Mississippi, Louisiana, and Texas, also have frequent lightning. Along the Atlantic Coast, North Carolina and South Carolina have frequent lightning.
Staying Safe from Lightning |
Why Is Lightning Mapping Important?
Lightning maps, lightning tracking, and lightning databases have many practical and academic uses. According to NASA's Lightning and Atmospheric Electricity Research Center, they are used as part of the activities below and much more:
 Severe storm detection and warning. Convective rainfall estimation. Storm tracking. Predicting aviation hazards. Warnings to power companies, fuel depots, golf courses, etc. Forest fire forecasting. Predicting cyclone development. Understanding the physics of the global electric circuit. Understanding the magnetosphere and ionosphere. Studies of NOx generation. Studies of whistler and other wave propagation phenomena. Magnetospheric-ionospheric research. Solar-tropospheric studies. Severe storm detection and warning. Convective rainfall estimation. Storm tracking. Predicting aviation hazards. Warnings to power companies, fuel depots, golf courses, etc. Forest fire forecasting. Predicting cyclone development. Understanding the physics of the global electric circuit. Understanding the magnetosphere and ionosphere. Studies of NOx generation. Studies of whistler and other wave propagation phenomena. Magnetospheric-ionospheric research. Solar-tropospheric studies. |
For more information about lightning and lightning mapping, visit NASA's Lightning and Atmospheric Electricity Research Center.
| More Geologic Hazards |
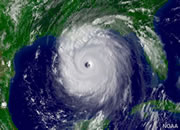 |
Largest Hurricanes |
 |
Gifts That Rock |
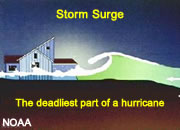 |
Storm Surge |
 |
World Record Lightning |
 |
Earthquakes |
 |
Landslides |
 |
Expansive Soil |
 |
Hurricane Names |

Find Other Topics on Geology.com:
|
| ||
|

| ||
|

| ||

|
|