Home » Oil and Gas » Decline of Natural Gas Well Production and Royalties Over Time
Production and Royalty Declines in a Natural Gas Well Over Time
The production rate of a natural gas well will decline over time,
and that will cause royalty payments to fall unless prices rise dramatically.
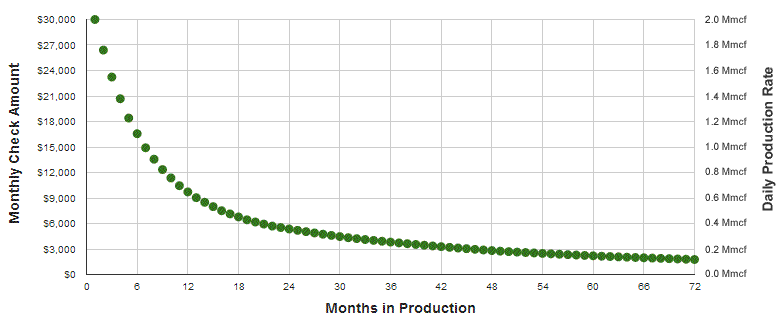
This graph shows how the monthly royalty rate and daily natural gas production rate of a hypothetical gas well can decline during the first six years of production. It was constructed using an initial production rate of 2 million cubic feet per day, a natural gas price of $4/mcf and a royalty rate of 12.5%. The left axis shows the amount of the monthly royalty check and the horizontal axis shows the months of production. The right axis shows the production rate in millions of cubic feet per day. The well starts with a rapid production rate and high royalty checks. These decline rapidly during the first year and by the end of the first year they have dropped by nearly 70%. The production rate declines in each successive year, and at the end of the six-year period the production is down to a little over 0.1 million cubic feet per day and the royalty check is down to about $1750. This is a drop of nearly 94%! Eventually, the well will yield so little gas that it will be uneconomical to operate and will be abandoned. This curve is a hypothetical example, and your well could do better or worse. Imagine what would happen if the natural gas price dropped to $2/mcf again? Decline rates vary from well to well as do production rates. Your well might be better or worse than this example.
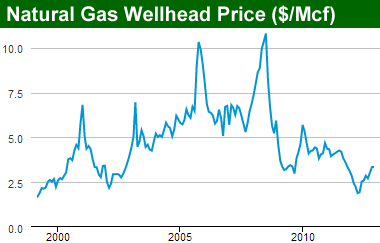
The wellhead price of natural gas can change rapidly over time. In the past few years the monthly average price has been as high as $11 and as low as $3. Data from the Energy Information Administration.
Declining Royalty Payments are Normal
Lots of property owners who signed a lease in one of the natural gas shale plays such as the Marcellus, Barnett, Haynesville, Fayetteville, Bakken, Utica and Eagle Ford are now receiving monthly or quarterly royalty payments. Many of these people were pleasantly surprised with the size of their first royalty check -- but then shocked to see the size of subsequent checks fall rapidly.
There was nothing wrong with their well. Sharp declines are normal.
Why Do Royalty Payments Decline?
Royalty payment declines occur because the amount of natural gas produced from nearly every continuously-produced shale gas well decreases steadily over time. When a new well is drilled it penetrates a rock unit with abundant gas, sometimes under pressure. These new wells can yield at a very high rate, but over time - as gas escapes from the well - the pressure in the formation goes down. The result is a well with a lower rate of yield. The graph at the top of this page shows the production and royalty rate decline for a hypothetical well during its first six years of production.
Notice how the decline is very rapid during the first year and then followed by slower but continuous decreases. The well shown in this graph had an initial yield of about 2.0 million cubic feet per day, but twelve months later the yield had dropped nearly 70% - to about 0.65 million cubic feet per day.
The result was a huge income drop for the property owner and the company that drilled the well!
| Year | Initial Production | Closing Production | Decline from Previous Year | Annual Royalties $4/mcf Gas 12.5% Share |
| First | 2.0 Mmcf/d | 0.70 Mmcf/d | 68% | $207,605 |
| Second | 0.70 Mmcf/d | 0.36 Mmcf/d | 41% | $82,037 |
| Third | 0.36 Mmcf/d | 0.25 Mmcf/d | 27% | $53,327 |
| Fourth | 0.25 Mmcf/d | 0.19 Mmcf/d | 24% | $38,966 |
| Fifth | 0.19 Mmcf/d | 0.15 Mmcf/d | 19% | $29,536 |
| Sixth | 0.15 Mmcf/d | 0.12 Mmcf/d | 18% | $23,428 |
| TABLE 1: Production decline statistics from a hypothetical natural gas well in shale with horizontal drilling and hydraulic fracturing. The decline rate for your well could be significantly different from what is shown here. | ||||
Expect Declining Royalties
Production declines this severe are common in unconventional natural gas wells drilled in shale. If you have a new well or have recently leased your property, it might be a good idea to be very conservative with your long-term royalty expectations.
Your income from that well is going to fall rapidly at first and eventually decline to zero.
Some wells do not show the same sharp decline as this example. Other wells decline more rapidly. Information from the decline curve above is summarized in Table 1 on this page.
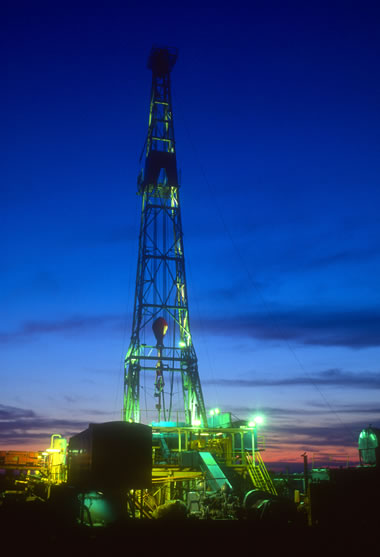
Drill rig at twilight. Upon completion of drilling, some operators are choking the flow of natural gas from the well to better manage the delivery of gas to their pipeline commitments and potentially increase the total yield of natural gas from the well. Image © iStockphoto, dgeffs.
Other Variables that Change Royalties
Other variables can cause a change in the amount of royalties paid on a well. The price of natural gas has taken wild swings over the past several years, moving from a high monthly average of $11.00 down to a low approaching $2.00 (see graph on this page). Changes in the price of gas will significantly modify royalty payments.
The United States currently has a glut of natural gas as a result of new technologies that extract gas from shale. This abundance of natural gas has kept prices low and has some companies willing to invest billions of dollars to build liquefied natural gas export facilities that will allow United States natural gas to be shipped to Asian and European markets where prices are higher.
As more and more wells are drilled, the only thing that can remove the downward pressure on natural gas prices is an enormous increase in natural gas use or export. This could happen. The federal government has approved a number of natural gas export terminals. Natural gas currently has a cost advantage over oil-derived fuels in vehicles. Utilities are starting to convert power plants from oil and coal to natural gas. These new uses of natural gas are occurring but not spreading rapidly.
Well Depletion and Closure
Eventually the yield of a well will decline so much that the income from the gas is less than the expenses required to maintain the well. At that point the well will be closed. Sometimes depleted wells are sealed and other times they are turned over to the property owner who may have a use for the small amount of gas that still flows.
The Useful Life of a Well
Horizontal drilling and hydraulic fracturing have been used to produce natural gas from shale for less than a decade in most parts of the United States. However, some general statements can be made about the productive life of a typical well. As described above, these wells will yield at a rapid rate immediately after drilling, and the yield will decline rapidly during the first year and then more slowly over time.
The yield during the first month after completion will reveal how valuable the well will be. Lower yield wells produce one to two million cubic feet per day. Many wells yield between three and five million cubic feet per day, but gigantic wells could produce as much as twenty million cubic feet per day. The more the well yields in the first month, the more valuable it generally will be over time.
The typical well might yield as much as half of its gas in the first five years of production. Wells might then continue to produce for a total of twenty to thirty years but at lower and lower production rates. Caution with production and royalty expectations is recommended because long-term experience from shale formations in the United States is not available.
The Red Queen of the Oil and Gas Industry
Oil and gas companies who drill some of the first wells in a new natural gas area usually do not have a way to deliver their gas to market. To obtain delivery they must enter into contracts with a natural gas pipeline company. The oil and gas company promises to provide a specific amount of gas per day and the pipeline company promises transmission capacity.
Imagine that an oil and gas company drills fifty wells during their first year in a new shale play. They contract with a pipeline company who will transmit that gas to market. One year after these wells are drilled, their production rate has fallen by 60 to 80%. So, to meet the amount of gas promised to the pipeline, the oil and gas company must drill at least 30 to 40 new wells to make up for the drop in production. At the end of the second year, the company has first-year production drops on all of its new wells and second-year production drops on all of the wells drilled in the first year. This forces the oil and gas company to drill, drill, drill to keep up with its promise to the pipeline.
Many people in the oil and gas industry call this the "Red Queen Effect." It is named after a character in Lewis Carroll's Through the Looking-Glass novel. The Red Queen lectures Alice: "Now, here, you see, it takes all the running you can do, to keep in the same place. If you want to get somewhere else, you must run at least twice as fast as that!"
Throttling New Wells?
In the early days of horizontal drilling and hydraulic fracturing of shale, it was customary practice to allow the well to produce at full capacity as soon as it was placed on line. This produced rapid income for the company and maximized the numbers in their next shareholder report.
Recent experiments suggest that throttling the production of a new well might result in a longer productive lifetime for the well and a greater total recovery of gas. The theory behind this is that rapid initial production allows the pore spaces in the shale to deflate unevenly. Pores near the well collapse first as the gas rapidly moves to the well and that causes more distant gas to be trapped within the formation. Slowing the production rate allows the pores to deflate more evenly and allows an orderly, more efficient and more complete gas recovery.
This idea remains to be proven, but some producers are starting to apply it. A second reason to throttle the gas is that it allows the company to better plan its production and drilling rates, match them to transmission capacity, and avoid the demands of the Red Queen.
New Gas from Future Technologies?
Current technologies are recovering a very small percentage of the natural gas that is held in the rocks. During the next twenty to thirty years, new methods for extracting gas from the Earth could be developed. It is possible that these new methods could be used to rework existing wells and renew their productivity. Only time will tell.
Author: Hobart M. King, Ph.D.
| More Oil |
 |
The Doorway to Hell |
 |
Oil Sands |
 |
Shale Gas Resources |
 |
Gifts That Rock |
 |
Horizontal Drilling |
 |
Oil and Gas Rights |
 |
Natural Gas Prices |
 |
Oil Shale |

Find Other Topics on Geology.com:
|
| ||

|

| ||

|

| ||

|
|